Each year WGEA publishes employer gender pay gaps in Australia on the Employer Data Explorer.
Looking for these 5 things in the data can help you uncover vital clues to the potential reasons for an employer's gender pay gap.
1. Does the employer pay men or women more, on average?
What to look for: Positive, negative or target range (between -5 and +5)
Employer gender pay gaps published on WGEA’s Data Explorer are shown as negative, positive or zero.
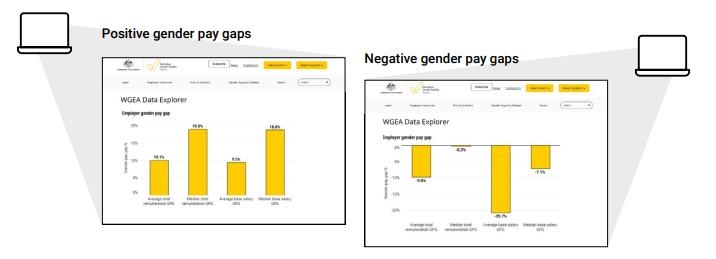
If the employer gender pay gap is positive: The average or typical pay for men is greater than women. This is often called a gender pay gap ‘in favour of men’.
If the employer gender pay gap is negative: the average or typical pay for women is greater than men. This is often called a gender pay gap ‘in favour of women’.
If the gap is in the target range (between -5% and +5%): Employers within this range are achieving a fair balance between the average or typical pay of women and men. The 10% range allows for normal workplace changes due to recruitment resignations and promotions.
Did you know?
- 71% of employers have a gender pay gap in favour of men
- 23% have a gender pay gap in the target range
- 7% have a gender pay gap in favour of women.
- (*Source: WGEA Gender Equality Scorecard 2024-25)
2. How big is the gender pay gap compared to others?
What to look for: The size of your gap compared to the national and industry mid-points
In addition to individual employer gender pay gaps, WGEA also publishes benchmark information for employers across industries and the nation on the Industry Data Explorer.
Comparing an employer’s gender pay gap to these figures can give you a sense of how big or small their gender pay gap is, relative to others.
You can also compare the gap directly to the employer’s peers using the Employer Data Explorer.
National mid-point
The national mid-point of average total remuneration employer gender pay gaps is 11.2%.
This means 50% of employers have an average total remuneration gender pay gap higher than 11.2% and 50% have a gender pay gap lower than 11.2%.
If the employer’s gender pay gap is larger than 11.2% it is in the highest half of all gaps.
The national mid-point is based on all employer gender pay gaps, and some of these will be negative (in favour of women).
Negative gender pay gaps that are beyond the target range need to be addressed just as much as positive ones.
Industry mid-points
Specific issues in an industry can impact the size of an employer’s gender pay gap.
If you compare an employer’s gender pay gap to the mid-point of its industry-wide employer gap you can see how an employer is performing, compared to relative peers within that industry.
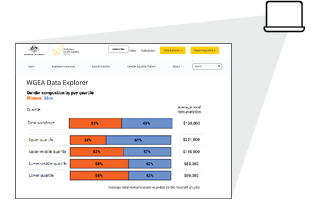
On WGEA's Industry Data Explorer, you can view the mid-point of employer gender pay gaps by Industry, Division, Sub-division, Group, and Class. These terms align to Australian and New Zealand Standard Industrial Classification (ANZSIC) of industries.
Industry is the broadest category, for example Construction. Class is the smallest category, for example within construction this might be Roofing Services.
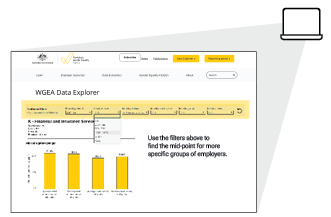
You can also use the size filter to only see the mid-points for a particular group of employers with a similar number of employees.
For an employer, the first critical step is to achieve a gender pay gap that is smaller than its industry peers. It demonstrates they have positive outcomes compared to similar employers.
The ultimate goal for employers, however, is to achieve a gender pay gap in the target range of –5 to +5% because this shows that outcomes for women and men are closer to fair and equal.
3. Are payments above base salary affecting the size of the gender pay gap
What to look for: The difference between the total remuneration and the base salary gender pay gap.
WGEA publishes base salary and total remuneration gender pay gaps for each employer on the Employer Data Explorer.
Total remuneration includes bonus or performance pay, overtime payments and superannuation as well as the base salary. It’s the whole package of what an employee takes home.
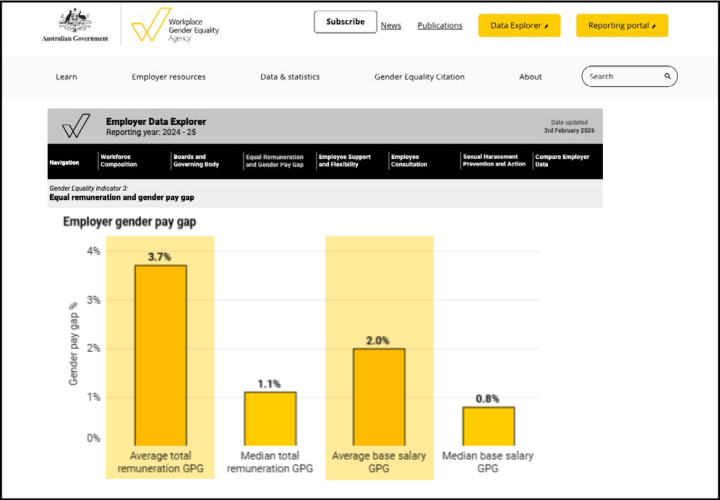
When the base salary gender pay gap differs from the total remuneration gap, this is a sign that the additional payments above base salary, many of which are discretionary, are favouring one gender more than another.
When the gender pay gap is positive and the:
total remuneration gender pay gap is higher than base salary gender pay gap: Men are earning more from payments above base salary. These additional payments are making the gender pay gap larger.
total remuneration gender pay gap is lower than base salary gender pay gap: Women are earning more from payments above base salary than men, on average or typically. This is reducing the overall gender pay gap.
When the employer gender pay gap is negative and their total remuneration gender pay gap is closer to zero than the base salary gap, men earn more on average from additional payments than women.
Did you know?
50% of employers pay men more than 29.7% more than women in discretionary pay?
4. Are a small number of highly-paid people making the gender pay gap larger?
What to look for: The difference between the average and median gender pay gaps
The Employer Data Explorer contains average and median gender pay gaps for each employer. The average tells you the overall pay difference between women and men, and the median tells you the ‘typical’ earnings difference.
Comparing the average and median can provide an important clue to what may be driving the gender pay gap.
The mathematical explanation
Average: To calculate an average, you add up all the items and divide by the number of items you have. The final value can be skewed higher or lower by small groups of extremely high or extremely low salaries concentrated in one gender, like a few high earning men senior executives.
Median: To get a median, you organise the numbers from smallest to largest and find the middle number. This means it is rarely affected by a small group of very high or very low salaries.
If the average and median are quite different, it can indicate the employer has a concentration of one gender earning either very high, or very low pay.
You can find the full mathematical explanation and equations for calculating gender pay gaps on the WGEA website. When expressed as a percentage, employer gender pay gaps are the average or median difference in proportion to men’s pay.
How to compare the average and median
The most common thing you will find is the average gender pay gap is further away from zero than the median.
The explanation for this differs based on whether the gender pay gap favours men (is positive), or women (is negative).
For positive gender pay gaps: For example, average gender pay gap 15%, median gender pay gap 10%. Men earn more, on average and typically and it’s likely a concentration of men in high-paying roles is causing the average to move away from the median.
For negative gender pay gaps: For example, average gender pay gap -15%, median -10%. Women earn more on average and typically and it’s likely a concentration of women in high-paying roles is causing the average to move away from the median.
5. What's happening in the organisation's pay scales to cause the gender pay gap?
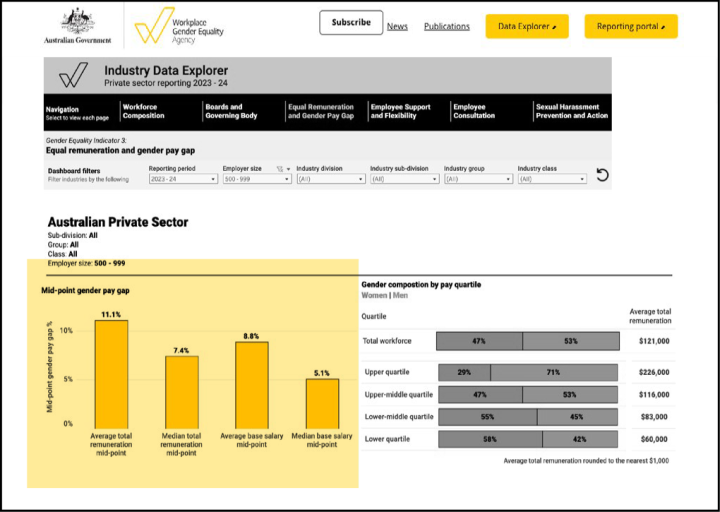
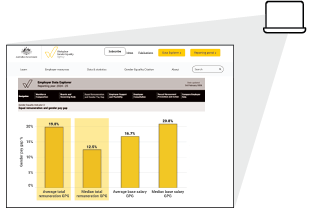
What to look for: Gender composition and average remuneration per pay quartile
WGEA publishes an employer’s gender composition and average total remuneration for the total workforce and each pay quartile in a graph alongside the gender pay gap information on the Employer Data Explorer.
The quartile graph shows the relative positions of women and men in high and low paying jobs. It can signal where the imbalance between women and men occurs.
When an employer has a small gender pay gap, the composition within each quartile is often similar to their total workforce composition.
Employers with larger gender pay gaps tend to have more deviation between the gender balance of the total workforce and the balance of women and men in some or all of these pay quartiles. For example, one gender may be overly represented in high paying roles and the other over-represented in lower paid roles.
Where there is an imbalance in the gender composition of the quartiles and a large difference in average pay between low and high earners this can result in a larger gender pay gap.
Did you know?
National data shows men are 1.8 times more likely to be employed in the highest earning quartile and women are 1.4 times more likely to be employed in the lowest earning quartile. (Source: WGEA Gender Equality Scorecard 2024-25)
Download the guide
Download a copy of the 5 things to look for in the employer gender pay gap data for your organisation.
Additional resources
Search for and compare more than 10,500 employer gender pay gaps using your newfound knowledge.
Find benchmarks for your industry or drill down further to find the mid-points by class, group or employer size.
Ready to become an expert? Find out how you can do a gender pay gap analysis to locate the drivers of the gender pay gap in your organisation.