WGEA’s Employer Gender Pay Gaps Report provides benchmarks for the analysis of employer gender pay gaps and identifies 3 key areas where progress can accelerate.
The appendix spreadsheet contains the employer gender pay gaps for 8,500 private sector workplaces, 126 Commonwealth public sector employers and 1,850 corporate groups. Combined, these organisations employ almost 5.9 million Australians. More details on each employer are available on the WGEA Employer Data Explorer.
The analysis in the Employer Gender Pay Gaps Report is based on private sector employers who reported to the Agency by the research dataset cut-off date of 31 August 2025. A small number of employers reported to WGEA after the cut off. Their information is included in the spreadsheet but does not count to the overall trend analysis. Commonwealth public sector employers are not included in the analysis as they report on a different timeline, but their gender pay gaps are included in the Excel appendix.
Additional resource: Understanding gender pay gaps: 5 things to look for in the employer gender pay gap data
Download the 2024-25 Employer Gender Pay Gaps Report
Download the report
Download the GPG spreadsheet
What does the data tell us?
The gender pay gaps WGEA released in 2026 reflect what employers were doing after WGEA published employer gender pay gaps for the first time in 2024.
In the years prior to publication, more employers took steps to understand their gender pay gaps and to identify the drivers.
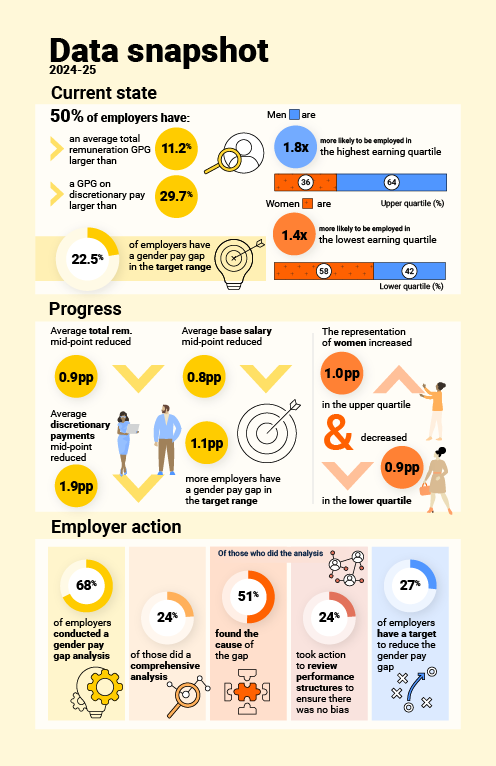
Progress is happening. The majority of employers reduced their gender pay gap year-on-year. More employers have a gender pay gap in the target range of -5% to +5% and slightly more women have moved into the upper quartile of earners.
Employers are reducing the size of their gender pay gap
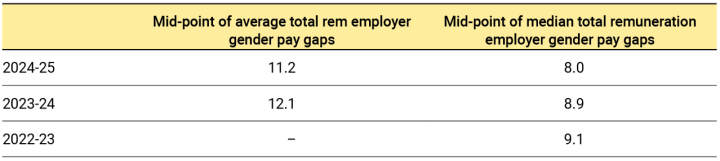
50% of private sector employers have an average total remuneration gender pay gap above 11.2% and 50% of employers have a gender pay gap lower than this point. This is known as the mid-point of employer gender pay gaps and it has reduced by 0.9pp in the past 12 months.
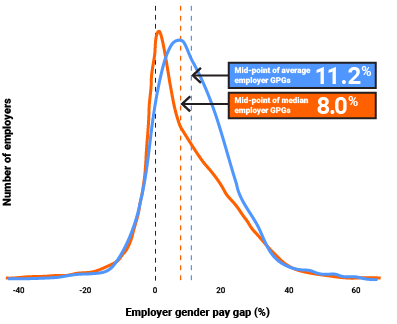
The mid-point of employer median total remuneration gender pay gaps is 8.0% and it has also reduced by 0.9pp year-on-year. Since WGEA first published employer gender pay gaps in 2022-23 the mid-point of median total remuneration gender pay gaps has reduced 1.1pp.
Nationally, 54.8% of employers reduced their average total remuneration gender pay gap year-on-year. 52.3% of employers reduced their median total remuneration gender pay gap year-on year.
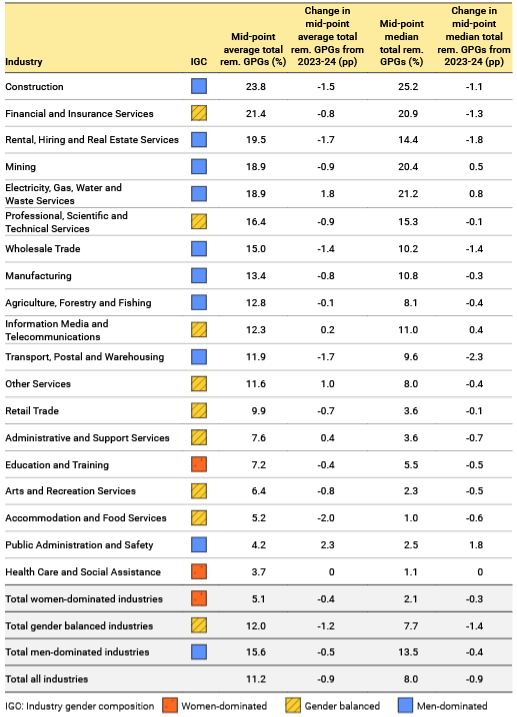
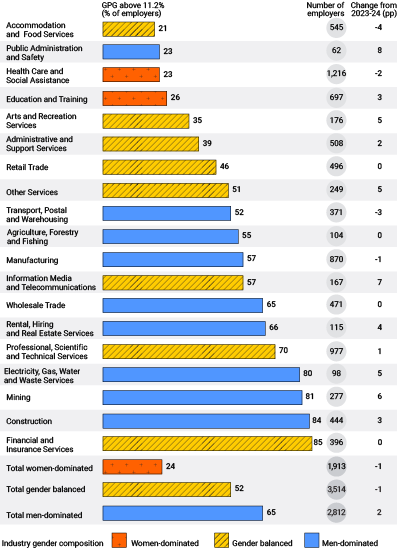
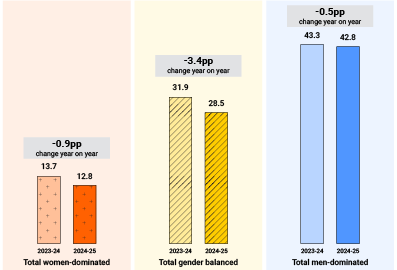
Specific issues within industries related to employee composition and pay can impact the size of employer gender pay gaps. Employers in men-dominated and highly-paid gender balanced industries often have larger gender pay gaps. This is seen in higher mid-points for these industries. The mid-point of employer gender pay gaps has reduced in many industries, but not all.
The employers with the largest gender pay gaps
When an industry has a mid-point higher than 11.2%, it means more than 50% of employers in that industry have a gender pay gap larger than the national benchmark. The higher the mid-point, the larger the size of the typical employer gender pay gaps for employers in that industry.
Employers with the largest gender pay gaps are most likely to operate in men-dominated or highly-paid gender balanced industries. In Financial and Insurance Services, Construction, Mining and Electricity, Gas Water and Waste Services, 4/5 workplaces have gender pay gaps above 11.2%. These industries have also seen an increase, or no change, in the proportion of employers with a gender pay gap above the national mid-point.
Differences in composition and pay impact the size of employer gender pay gaps
Gender pay gaps are the result of imbalances in gender composition and remuneration across the organisation.
Employers with larger gender pay gaps tend to have more deviation between the overall representation of women and men in the workplace and their representation in some or all of the pay quartiles. For example, one gender may dominate high-paying roles and the other may dominate lower paying roles. For the gender pay gap to close, women and men need to have more balanced representation within and across the remuneration quartiles.
At a national level, women and men are evenly represented in the total workforce captured by WGEA reporting. But men are 1.8 times more likely to be employed in the highest earning quartile and women are 1.4 times more likely to be employed in the lowest earning quartile.
In the past 12 months the representation of women increased 1pp in the upper quartile and decreased 1pp in the lower quartile. The other quartiles stayed the same. One of the reasons for this change was a small net increase in women in management roles, with higher pay.
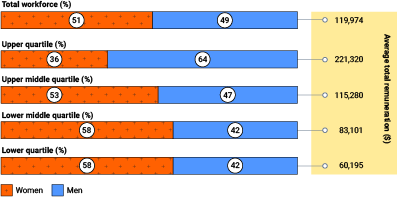
The difference in pay between the quartiles can contribute significantly to the size of the gender pay gap if an employer concentrates one gender in the highest earning quartiles and the other gender in the lowest earning quartiles. Nationally, the average total remuneration in the highest pay quartile, which is dominated by men is 3.7 times higher than that of the lowest pay quartile, which is dominated by women.
When the balance of women and men in each of these quartiles is uneven, differences in wage growth between these quartiles will change the gender pay gap.
The average remuneration for all employees grew by 3.6% year-on-year. But this growth was larger in the lower (4.3%) and lower-middle quartiles (4.5%) which are dominated by women, than in the upper quartile (3%) or the upper-middle quartile (3.7%) which are dominated by men. This has contributed to a reduction in the overall gender pay gap.
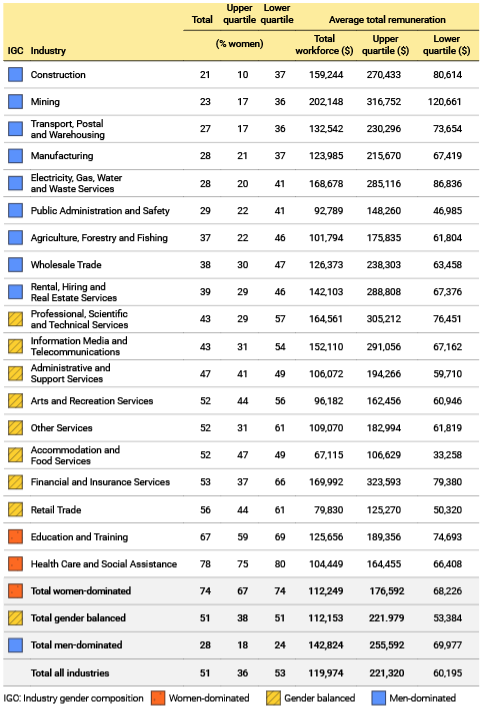
Industries with the highest average total remuneration often have the largest employer gender pay gaps. This occurs due to the combination of larger differences in average remuneration between the quartiles and the uneven distribution of women and men in each of those quartiles.
More employers have a gender pay gap in the target range
1.1pp more employers have a gender pay gap in the target range in 2024-25 compared to 2023-24. WGEA determines gender pay gaps within and including ±5% to be within the target range. This allows for fluctuations due to normal workplace changes in composition and pay.
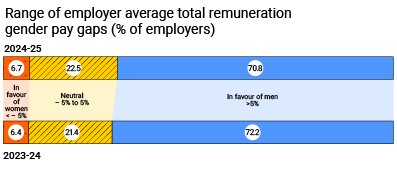
Employers in women-dominated industries were the most likely to have a gender pay gap in the target range in 2024-25.
Additional payments drive many employer gender pay gaps
Additional payments above base salary including superannuation, bonuses and overtime, which can be seen in the difference between base salary and total remuneration, contribute significantly to the gender pay gap for many employers.
While superannuation is a mandated payment, other payments above base salary are discretionary. They are often generated as a reward beyond the expected outputs of a given role or available to those who can work extra hours. Performance bonuses, allowances and access to overtime are often determined by line managers in conjunction with People and Culture teams and the relative importance of each of these varies by industry.
Research shows they are rarely objective. As a result, women earn significantly less, on average, from these payments than men. This contributes to lifetime earning deficits.
Using the superannuation guarantee (11.5% in 2024-25) to estimate the proportion of the additional payments attributed to superannuation, WGEA calculated the average gender pay gap on just the discretionary pay such as performance bonuses, allowances and overtime payments.
The mid-point of employer gender pay gaps on discretionary pay is 29.7%. This means 50% of employers pay men more than 29.7% more than women in bonuses, overtime and additional payments.
While this gap has decreased from 31.6% in 2023-24, the size of the gap shows many employers need to consider whether gendered biases are built into their discretionary payments processes.
Employers in men-dominated industries have the highest discretionary pay gender pay gaps. They also made the least progress on closing these gaps year-on-year.
How progress on closing the gap can accelerate
The Employer Gender Pay Gaps Report identifies 3 key areas where more focus from employers could accelerate their progress in closing the gender pay gap.
- Doing a more comprehensive gender pay gap analysis
- Choosing actions to improve fairness that are based on the analysis and supported by evidence
- Setting targets to improve accountability and measure progress.
Download the full report for the full details on how and why these actions can drive change.
Explore the data
The 2024-25 Gender Pay Gaps Report is based on the data of 10,500 employers, representing the workplaces of almost 5.9 million Australians.
Explore the data and information received from employers on a national basis, by industry or by individual employer in WGEA's Data Explorer.
Resources and support
Book into an employer masterclass to learn how to conduct a gender pay gap analysis, build an action plan, select gender equality targets or design roles for part-time.
A step-by-step guide on how to plan and execute a gender pay gap analysis.
Everything you need to know about selecting gender equality targets.